
Map Created by Author; Data Source: [38]
Based on 2010 Census Data and Boundaries
|
Region
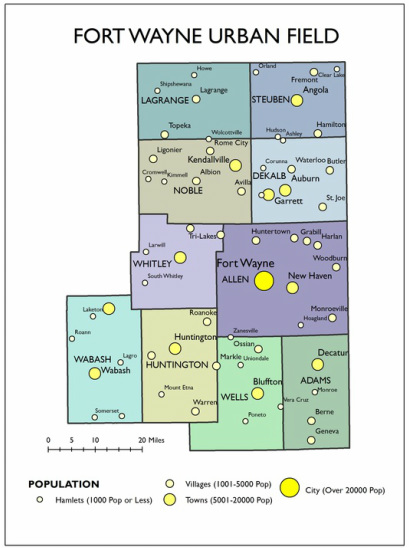
Fort Wayne is the economic anchor for a fairly large portion of northeastern Indiana. The Northeast Indiana Regional Partnership recognizes Fort Wayne as the center of a very specific yet wide-reaching geographic region of ten individual counties, as seen in the map to the left. The organization has identified six “target industries” as a focus for economic growth in this region, which include vehicles, defense, food processing, insurance, medical devices and logistics [33].
An initiative called Vision 2020, stewarded by the NIRP, seeks to “develop, attract and retain talent” in Northeast Indiana using appropriate strategies to ultimately become a “top global competitor” [40]. An important aspect to recognize here is that a very large geographic area, much larger than the Fort Wayne MSA and including a significant amount of rural lands, is distinguished as a single economic place with various advantages and qualities that can be showcased. In essence, these ten counties appear to comprise one urban field, which is defined as “the sphere of influence of the city, as constituted by its economic and social zone of control” [23, p. 82]. Generally speaking, Fort Wayne could be considered a dominant city within a hierarchical system of regional cities and towns. As a Midwestern city in a topographically flat area of Indiana, it is virtually surrounded by agricultural lands and farming communities for miles and has hence become the center of commerce for its extended trade region. Hartshorn has cited the American Midwest as a prime example where "a hierarchical city size and spacing pattern occurs in an agrarian area where the support base" provides goods and services to the surrounding rural areas, which tend to be homogeneous in nature [24, p. 61]. It is likely that institutions present within the Fort Wayne urban field, such as wholesaling, shopping, and higher education, serve a much broader scope than just those areas that are considered ‘urban’ or ‘developed.’ For example, Glenbrook Square Mall is identified as a super-regional shopping center with a trade area population of close to 510,000, so it is quite possible that customers may come from distances “within an afternoon’s drive” to partake in the pleasures of shopping [20; 23, 82]. |
|
City
As for the City itself, it could be stated that Fort Wayne exists as a virtually truebound city, a place where the physical growth that has occurred over time coincides, more or less, with the legal corporation limits, with the exception of developed places such as New Haven and Huntertown [7, p. 15].
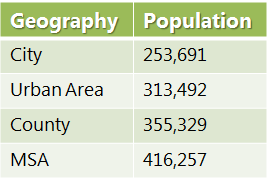
The unique structure of the city has allowed it to be divided into four quadrants, as shown in the map to the right. Each quadrant has distinctive characteristics and comprises different neighborhoods. Because the majority of the urban and suburban population lives in Fort Wayne, people will often identify themselves as being from one of the four quadrants: Northeast, Northwest, Southeast, or Southwest. The Maumee and St. Mary’s rivers, along with West Jefferson Boulevard, roughly form the boundary between the northern and southern quadrants. The two southern quadrants are split down the middle by Calhoun Street, while the St. Joseph River divides the two northern quadrants from one another. The spatial fabric of the City of Fort Wayne has been greatly influenced by trends in segregation, class structure, and economic development. It is very clear that Fort Wayne benefits/suffers (depending on which area observed) from uneven development, a concept which “refers to the fact that some cities receive much more investment than others and that some sections within cities receive much more investment than others” [28, p. 188]. Overall, the negatives of Fort Wayne’s spatial structure may not be as pronounced as other Midwestern cities, but the city does exemplify many of the typical patterns observed through an economic and socioeconomic lens. |
Source: City of Fort Wayne
|
|
Rank-Size
Rank-size rule was first brought into the urban development conversation by Zipf in 1949, who studied the sizes of cities among countries and looked at patterns implicit in their rankings [24, p. 62-63]. According to the rule, if one knows the rank number of a certain city within a country (or region in the case of this module) and the population of the largest city in that country, the population of the given city could be estimated assuming a gradual, linear decrease in population size from low to high ranks [26, p. 76].
The graph to the right displays the top ten largest Census-designated Urbanized Areas in Indiana as of the 2010 Census. The Urban Area definition is best at defining the population of a given metropolitan/urban region, including any suburban areas surrounding the central municipality. As can be seen, Indianapolis is clearly the dominant, maybe even primate, region for the State of Indiana. Of course, the Fort Wayne region is the largest among all remaining urban areas. Compared to the top 25 urban regions in an extended Midwestern region of the four states bordering Indiana (Illinois, Kentucky, Michigan and Ohio), Fort Wayne falls 16th and is even further removed from the height of dominate metropolitan regions like Chicago and Detroit. |
Rank Size: Top 10 Census Urbanized Areas in Indiana

|
Rank Size: Top 25 Census Urbanized Areas in Indiana and All Bordering States

|
|
Race and Ethnicity
The map animations to the left help visualize structural demographic changes that have occurred in Fort Wayne and Allen County since 1970. It should be noted that the two major interstates and three major rivers serve as a graphic reference for each decade, even though I-469 was not built until the late-1980s.
The manifestation of racial segregation is fully realized in 1970, as presented by the time series in the top left. In 1970, black residents of Fort Wayne were mainly concentrated in the neighborhoods just southeast of downtown Fort Wayne, but not too much further south. In the decades to come leading up to 2010, a shifting and re-distributing trend for the city’s black population is quite clear. Blacks have continued to migrate in a southern direction further and further away from downtown, though the original historically-black Census Tracts still contain significant black populations. Many of the far-flung areas in the southern portion of the city are suburban in character, which seems to indicate that middle-class blacks are leaving highly impoverished areas in the inner city for more desirable areas in the south. However, very little of the black population has crossed the St. Mary’s or Maumee Rivers to the southwest and northeast portions of the city, which are mostly white. Fort Wayne is also home to a significant and growing Hispanic population. A large influx of Hispanics between the years 1990-2000 and 2000-2010 is visible in the time series in the center left. The largest concentration of Hispanics is in the Larez neighborhood, with a 31% Hispanic population in 2010 for the Census Tract that is most equivalent to the neighborhood boundaries [31]. As evidenced by the time series, though there is a more widespread dispersion of Hispanics by 2010, most of the ethnicity is concentrated in the same quadrant as the black minority population. There appears to be a fair degree of mixing between the two minorities in certain sectors of the city as well. As seen in the time series in the bottom left, the percentage of foreign-born persons per Tract experienced a massive spike between 1990 and 2000. Such a trend can be challenging for cities as new cultural influences take shape. In 2009, Fort Wayne began participation in the National League of Cities’ Municipal Action for Immigrant Integration program, which focuses on “promoting civic engagement and naturalization among immigrant communities in U.S. cities” by helping city officials to form beneficial relationships with organizations serving immigrant communities [9]. In 2008, a new Community Resource Center for Refugees was opened to help serve the needs of the growing immigrant population, “many of whom are political refugees” [9]. Mayor Tom Henry commented that “Fort Wayne cannot afford to have an ‘us and them’ mentality,” recognizing the deep immigration history of both the city and the country as a whole [9]. |
|
Poverty and Class Structure
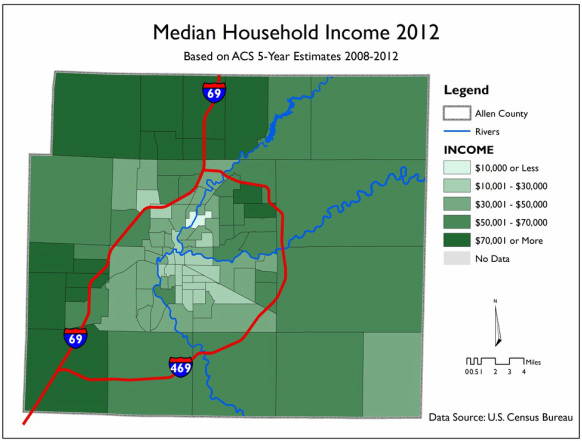
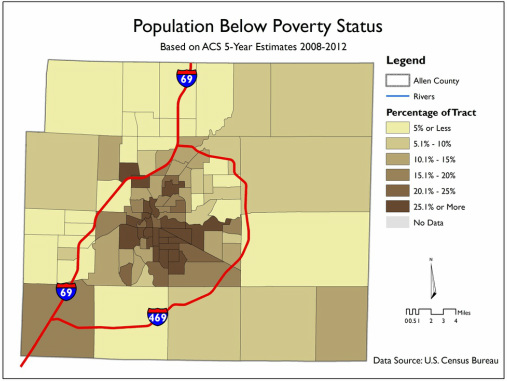
The maps on the right help visualize the current socioeconomic class structure in the City of Fort Wayne. The wealthiest areas of the city are on the southwestern, northeastern, and northern outskirts of the city far away from the central downtown, as demonstrated by the darker green colors for Census Tracts seen in the top right map. Though poorer neighborhoods are somewhat dispersed around the city, the highest concentrations of poverty are located in districts just southeast of downtown Fort Wayne.
The Tract with the highest poverty percentage, according to ACS 2008-2012 estimates, encompasses the western half of the central downtown area with a poverty rate of 56.8%. However, this percentage only represents a population of 835 people - therefore, it does not give a good indication of concentrated poverty. The Tracts with the second and third highest poverty percentages (55.2% and 54.5%), however, are located along the railroad tracks southeast of downtown, with total populations of 2,235 and 1,958 respectively. This conveys a much greater concentration of poverty in this area. It is not surprising that the most disadvantaged districts of the city are located near older, decaying industrial areas and brownfields, including the former International Harvester plant. On the north side of the railroad tracks, the East Side Community, McCormick Place, and Harvester Community neighborhoods together form an area with the third highest poverty rate for the city (54.5% for the bounding Census Tract). Other impoverished neighborhoods on the southeast side (south of the railroad corridor) include Chapel Oaks, Hanna Creighton, Oxford, and Pettit-Rudisill. Spatial divisions are evident, given the contrast in character between districts. For example, Calhoun Street on the south end (see bottom image) appears to assume the role of an informal boundary between the more desirable western neighborhoods and the eastern neighborhoods characterized by the highest disparities and worst physical conditions. Of the neighborhoods mentioned, most of which are defined by poverty rates greater than 40%, most possess common characteristics of high-poverty neighborhoods. Common characteristics of such neighborhoods, as claimed by Dreier, Mollenkopf and Swanstrom (2004), include “abandoned houses and lots, vacant businesses, cars rotting in driveways, idle men standing on corners, and many liquor stores but few banks” [13, p. 54]. The residential fabric of the grids within these districts is noticeably patchy, with a large amount of vacant grassy lots. As will be discussed in the next session, there is a correlation between areas of concentrated poverty and racial and ethnic minorities in the city, which implies that residential segregation has inexorably produced economic segregation [13, p. 58]. |

The iconic "water tower" of the former International Harvester plant on the southeast side of Fort Wayne, as viewed in Google Street View.
|
The "Invisible" Boundary - Calhoun Street in the South End

Spatial socioeconomic division between the east and west, as viewed in Google Maps. The yellow line is South Calhoun Street, which runs north to downtown.
|
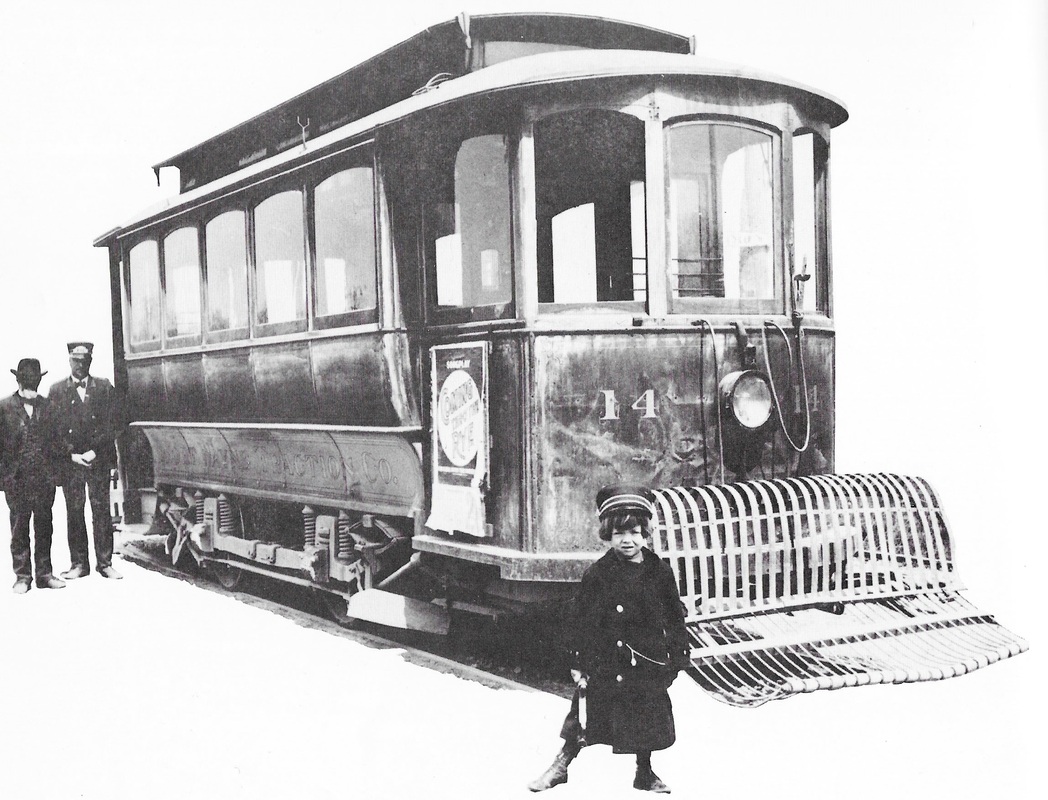
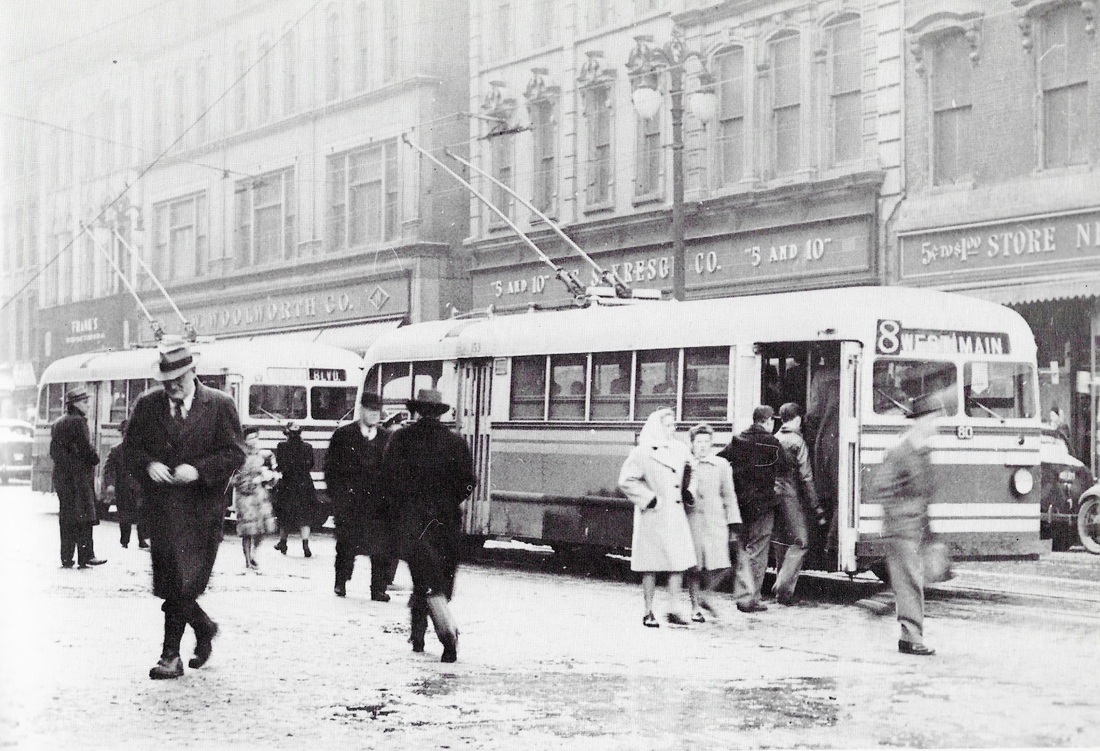
Electric streetcars allowed for the first new subdivisions to be constructed in what had mostly been a very compact City of Fort Wayne. The central hub of the streetcar network was Transfer Corner, at the corner of Main Street and Calhoun Street downtown, which was the busiest intersection in the city until the later half of the 1940s. Despite the influence of the trolleys/streetcars, private automobiles had the most dramatic effect on the cityscape of Fort Wayne. By 1942, the mode of commute for half of all city workers was private automobile transportation [47, p. 108]. Because of the increase in the number of cars on the road, this made traffic congestion a serious problem as downtown streets became flooded with cars during rush hour. Several solutions were offered to fix the traffic problems, including one-way streets and even a proposal to route a freeway straight through downtown, though this never materialized. Electric buses which followed the streetcars were eventually replaced by motor buses, and to this day Fort Wayne boasts as extensive transit system called Citilink. A new hub called "Central Station" was recently constructed downtown. Click here for current photos of the hub.
|
Transportation
Fort Wayne Citilink Transit System Map
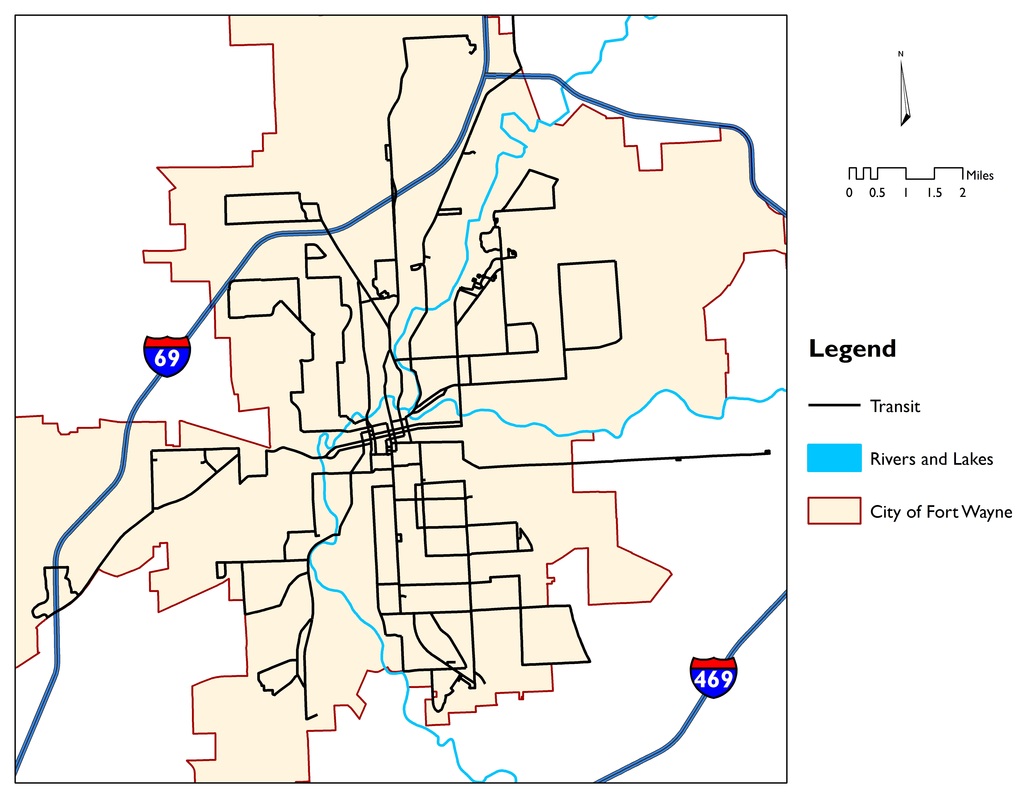
Data courtesy of City of Fort Wayne Planning Department
|
|
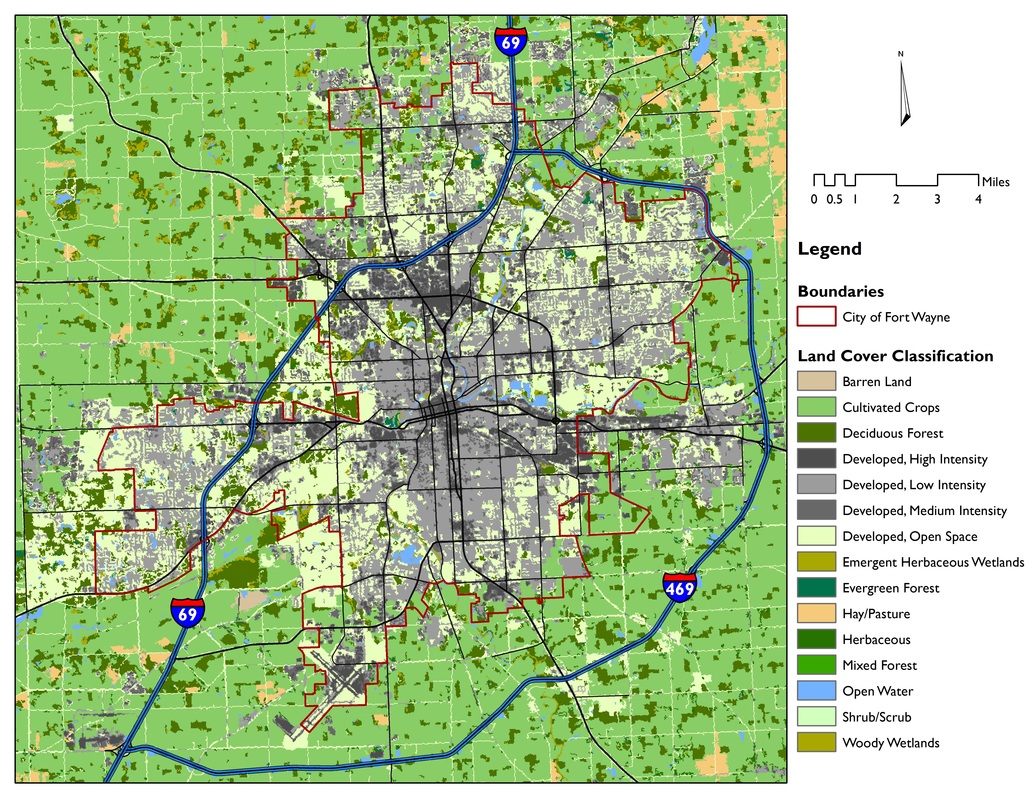
Land
Economic forces over time have had a tremendous effect on land use and growth patterns in the City of Fort Wayne. The city had been an industrial powerhouse for much of the 20th century, and was even touted as the "Heavy-Duty Truck Capital of the World" by one journalist from the News-Sentinel [18]. As can be seen in the land cover map to the right, these trends have left behind an impression in the city's urban fabric. If you look closely, you can observe at least four distinct areas that are intensely developed. One of these is the downtown area, two of them are major retail areas (one of which combines with a major industrial area to form a single conglomerate of intense development), and one is the old eastern industrial area. The more sprawled sections of the city, that is those areas that contain mostly low intensity development and developed open space, are located in the west, north and northwest sections. Very little sprawl exists to the south. There is a reason for this, as most working class residents of Fort Wayne during the industrial heyday lived in the southeastern section. International Harvester, Magnavox, and other major industrial players employed thousands of workers.
THE CASE OF THE SOUTHTOWN MALL When International Harvester closed in 1983, the loss of nearly 8,000 jobs had a very negative impact on the city, particularly the southeast quadrant. The status of the Southtown Mall throughout these years is indicative of the economic changes which took place. Southtown was built around the same time Glenbrook Square was built, which remains a healthy and viable mall in the north end to this day. The mall was prosperous into the 1970s as industry thrived, and residents had disposable income to spend at retail destinations. International Harvester had expanded its operations in the 1960s, and Southtown Mall also grew in size in the 1970s by adding an additional wing. However, it too declined in the 1980s and became a derelict structure by the 1990s. The mall site was eventually condemned and subsequently bought by the City to be handed over to a developer to redevelop it as a new big box retail center (with a Wal-Mart and Menards) [4, p. 148]. |
Evolution of the Southtown Mall Site
Imagery Source: iMap Allen County GIS Portal, http://www.acimap.us/portal/
|
|
Downtown Fort Wayne: 1938-2012
Imagery Source: iMap Allen County GIS Portal, http://www.acimap.us/portal/
|
Decentralization
|
